
Note: All pages shown are subject to having relevant Roles and Permissions.
In this guide, we will show you how to configure the Insight Dashboard. The Insight Dashboard can be used to view information on the following 5 areas;

In addition extra user defined panels can be added to the Insight Dashboard.
The user can also configure what panels are visible by clicking on the top right Settings drop down and ticking or unticking the 5 panels on the left.

Role specific views can also be set from the View Insight Settings drop down.

Click Save and Close.
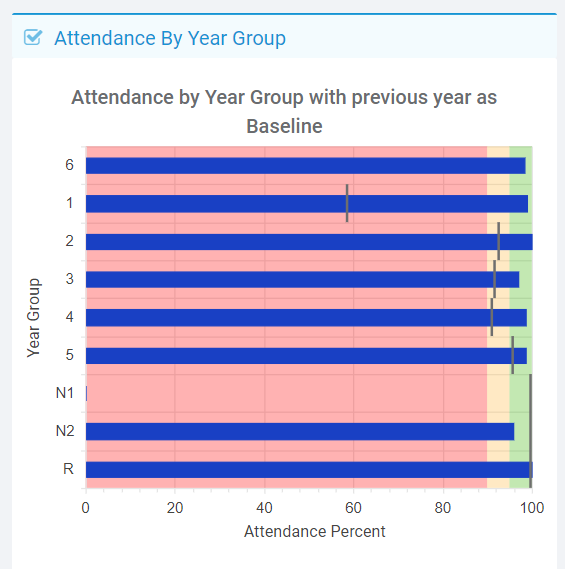
Attendance Percentage by Year.
This chart displays the Attendance Percentage for each Year Group with a grey line for Previous Years Attendance Percentage displayed for each Year Group.
Behaviour Events by Tutor Group
This chart shows the number of Negative and Positive Behaviour Events awarded for each Tutor Group showing averages for Negative and Positive,

Current Student Enrolment
This chart shows Current Student Enrolment totals plus split down by Year Group and Gender

Pupil Premium Students
This chart shows Pupil Premium Student total plus split down by Year Group and Gender.

Staff Absence
This widget shows Week to Date Staff Absence and Year to Date Staff Absence with the ability to filter down by Staff Type, Faculty, Department and Subjects.

Add a User Defined Panel
To add a User Defined Panel click the top right + in Settings and choose from Assessment, Attendance or Behaviour

In this example Attendance has been chosen, the Panel Title has been changed to Attendance Summery for Maths Class YTD
The Monitoring Period has been changed to Year.
The Group Type has been changed to Teaching Class and all the Maths Classes have been chosen, click the Blue Arrow to move the Teaching Classes into the right hand side box.
All Attendance Codes have remained in the First Absence Today.
Click Save

Now the panel will show the Students with First Absence Today for the selected Teaching Classes.

Click on the Pie Chart symbol to see overall attendance percentages for the selected Teaching Classes.

Click on the Time Line icon to see a Time Line of Attendance for the selected Teaching Classes.
