
Note: All pages below are subject to having the relevant Roles and Permissions.
Assessment Administrators can use this guide to create a Grade Distribution Analysis to analyse a single Assessment Type.
See also How to Set Up Analysis for Assessment – Student Grade Analysis by Subject
Complete Analysis Data Transfer
Important Note: In order for Assessment information to be visible in the Analysis Module you must first complete an Analysis Data Transfer which transfers data from the Assessment Module into the Analysis Module.
To do this go to Modules>Analysis>Analysis Data Transfer

This screen defaults to Transfer On Roll Students and Current Year Only, these choices can be amended if required.

Click Transfer Now, note this process will take several minutes, once complete you will receive a notification pop up on the top right of the screen.

You have now completed the Analysis Data Transfer.
Create a Template
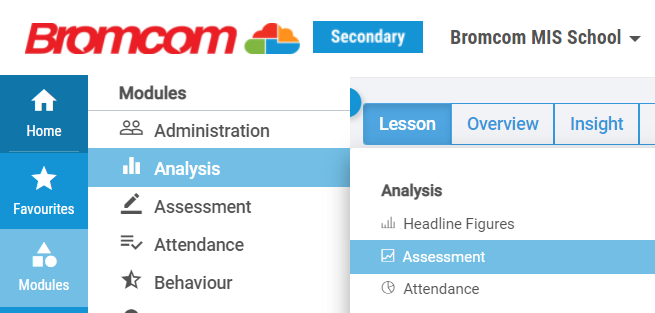
From the Home Page choose Modules>Analysis>Assessment
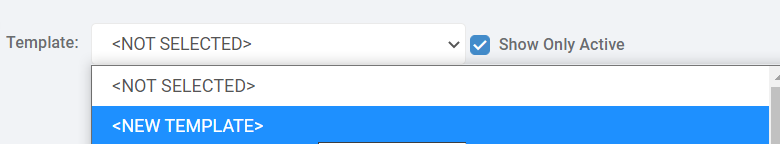
If you are creating a template for the first time then from the Template drop down choose NEW TEMPLATE
Give the Template a Name and from the Analysis Type drop down choose Grade Distribution.
You can define which Role(s) have access to the Template if required or leave blank so all roles who have access to the Analysis Module can see the Template.

Click Save.
Now you need to work along the top right tabs for Data Scope, Cohort and Options to define what you are doing a Grade Distribution for.
Click on Data Scope.
From this panel you can:
- Define a single Assessment Type to create a Grade Distribution for.
- Define Key Stages
- Define Subjects or leave blank for all Subjects.
- Define Terms
- Define which Year choosing from Current Year, Specific Year Groups or Last Year.
In the example below the Current Assessment Type, Key Stage 4, Autumn 1 and Year Group 11 has been chosen.
Note; for a drop down choose a single item, for a white box click to choose multiple items.
Click Save and Apply.

Next click on the Cohort tab.
From the Students drop down choose either Active Today, Between or Active On

Then from the Filters drop down we have selected Enrolment Status On Roll.
Click Save and Apply.

The Grade Distribution is now visible in table form.
Tables and Charts
In the example below for Art , 7 students have a Grade 3.

Click on an individual Subject to see a Bar Chart for that Subject, in this example English has been chosen and on the Breakdown by below the Chart Class has been chosen.
Choose Number or Percentage for the Grade Distribution Table below the Bar Chart.

Note you can Export, Copy or Print the Tables using the Grid Actions.
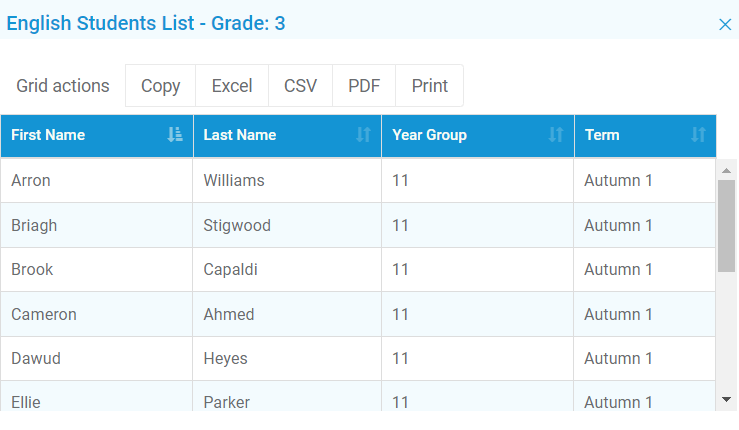
Click on the columns in the chart to see a table of Students who have achieved that particular grade.
Use the Grid Actions to Copy. Export or Print the list.
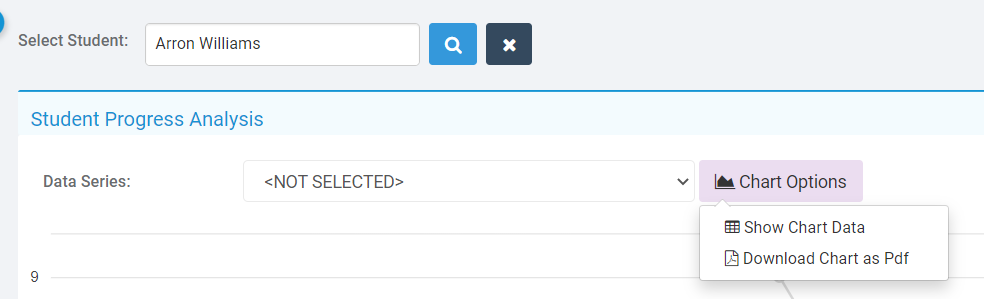
Click on a Student in the table to see a Student Progress Chart.
Student Progress Chart
See the section on Tables & Charts in this article to drill down to Student and View the Student Progress Chart.

Click on the Data Scope drop down to define the Assessment Type, Subjects and Terms visible in the Student Progress Chart.

Click on Chart Options to Show Chart Data or Download Chart as a PDF.
Show Chart Data;

Download Chart as PDF;
Option to print or download.

Hover over points in the Chart to see the Data

Click on the Data Series drop down to change the Assessment Type;
