
Attendance Officers can use this guide to create user defined charts and tables showing Attendance Analysis. For example you can create a chart with attendance data by tutor group for student with below 100% attendance
Access: the minimum permissions required for Attendance Analysis are found in the Analysis Module from Config>Set Up> Roles and Permissions

See also How to Access Attendance Analysis Exports, How to use the Attendance Dashboard and How to Access Attendance Reports.
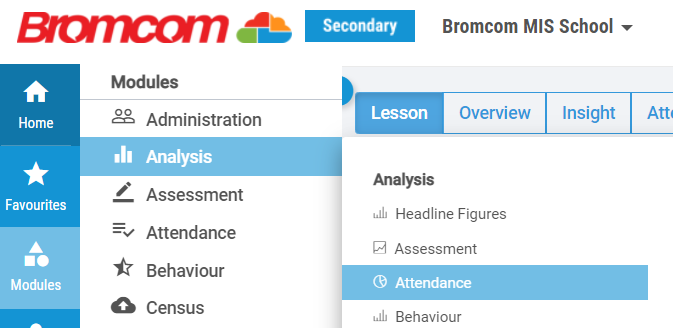
From the Home Screen choose Modules>Analysis>Attendance.
From the Template drop down select New Template.

In the Settings tab give the Template a name and select which role(s) have permission to see the Template. Note: Active is ticked as default, untick to make the Template Inactive.

You also have the option in the Settings tab to add Filters to your Template.

Click the Green + to add a Filter and choose from either Attendance or Behaviour. You can have more than one
In this example we have filtered by Below 95% attendance for present, authorised absent and educational activity. Select the required Date Range.
Use the Name box to give your Filter a Name.
Click Save.

Click Save.
Next click on the Data Scope tab to define the Scope for the Analysis.

Complete the Data Scope fields as required.
- Interval: choose either Academic Year or Date Range from the drop down
- Academic Year: choose from the drop down – note 2020 refers to 2020-2021
- Period/Session: choose from the drop down
- Attendance Types: Type in the Attendance Type(s) you want to analyse
- Tick to Treat Educational Activity as Present as required
- Tick to Show Late Attendance Separately as required
Click Save and Apply.
Click on Cohort to define the Cohort for the Analysis.

Complete the Cohort fields as required;
- Students: choose from the drop down choices , the default is Active Today.
- Filters: use this section to apply filters if required, in this example Enrolment Status = On Roll and Year Group = 11 has been selected.


Click Save and Apply.
Once you have completed the Settings, Data Scope and Cohort use the Breakdown by drop down to populate the analysis chart.

In this example Breakdown by Ethnicity has been selected and on Chart Options a Separated Bar Chart has been selected.
Click on Chart Options to Choose Chart Type, Chart Value and Properties.


Hover over each Stack in the Chart to view the data relevant to the selected Stack.
Click on Chart Options and choose to either Show Chart Data, Download Chart as PDF or Switch Row to Column
Click on Show Chart Data to show the Chart Data List with Grid Actions to export, print and sort the table.

Choose Download Chart as PDF with the option to download and print the Chart.

Click on the Chart Legend to remove items from the Chart, in this example Unauthorised Absent has been selected to remove it from the Chart. Click back on Unauthorised Absence to add back to the Chart.

Click on a Stack to Show the Data for the selected Stack and then use the Grid Actions to Copy, Export in Excel, CSV or PDF format or Print the List.
Click on the column headers in the table to Sort the list.
