
Note: All pages below are subject to having the relevant Roles and Permissions.
Behaviour Administrators can use this guide to create user defined charts and graphs to analyse Behaviour Events, Event Types or Adjustment Types.
See also Behaviour Overview.
From the Home Screen choose Modules>Analysis>Behaviour.

To create a new analysis click New Template from the drop down.

In the Settings Tab give the Template a Name and define which Role(s) can see the Template.
Click Save.

From within the Data Scope Tab select the required fields from the drop down choices;

Interval: choose Academic Year OR Date Range
Academic Year: choose a single year from the drop down. Note 2020 refers to 2020-2021
Analyse By: Choose either Event, Event Types or Adjustment Types and then from either Events, Event Types and Adjustment Types choose the required components dependant on the Analyse by choice.
In this example Analyse By is set at Adjustment Types and Adjustment Types has been set at Negative. Note: more than one adjustment type can be chosen.

Click Save & Apply.
Complete the Cohort fields as required:
- Students: choose from the drop down choices , the default is Active Today.
- Filters: use this section to apply filters if required, in this example Enrolment Status = On Roll has been selected.
Note more than one filter can be applied.


Click Save and Apply.
Once you have completed the Settings, Data Scope and Cohort use the Breakdown by drop down to populate the analysis chart.

Click on Chart Options to Choose Chart Type, Chart Value and Properties.

In this example Breakdown by Tutor Group has been selected and on Chart Options a Separated Vertical Bar Chart has been selected.

Hover over each Stack in the Chart to view the data relevant to the selected Stack.
Click on Chart Options and choose to either Show Chart Data, Download Chart as PDF or Switch Row to Column

Click on Show Chart Data to show the Chart Data List with Grid Actions to export, print and sort the table.

Click Download Chart as Pdf to save the chart locally with the option to print/save.
Click Switch Row to Column.

Click on the Chart Legend on the right to remove items from the Chart, in this example 08A and 08B have been selected to remove them from the Chart. Click back on the Tutor Groups to add them back to the Chart.

Click on a Stack to Show the Data for the selected Stack and then use the Grid Actions to Copy, Export in Excel, CSV or PDF format or Print the List.
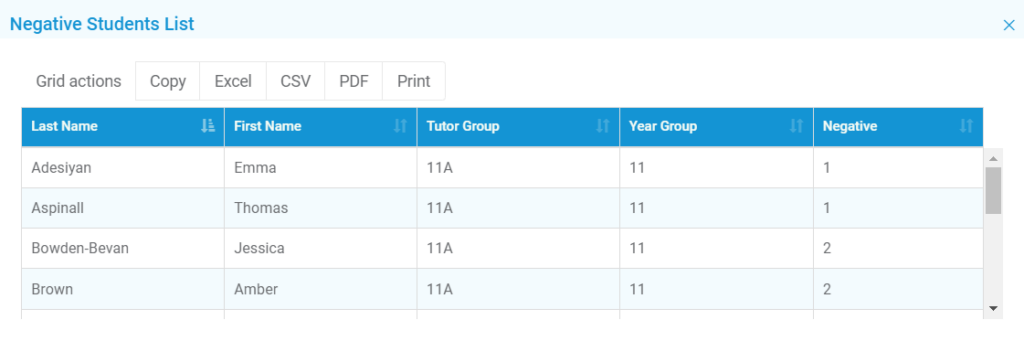
Click on the column headers in the table to Sort the list.