
Note: All pages below are subject to having relevant Roles and Permissions.
The Attendance Dashboard has the option to view National Headline Measures Information including Local Authority and Regional Data, initially from Autumn 2020. The selected Benchmark Data will reflect the schools Individual, Local Authority or Region.
Note: Bromcom is providing a set of Attendance Comparison for Schools based on the Data collected Anonymously from all Consenting Schools signed up to participate. Data will be Collected Daily, Stored Centrally and pushed statically to provide Comparisons for Individual Schools based on its Characteristics, Location and Intake type.
Giving Consent to Share Data
Dashboards > Attendance
If Consent to Share Data has NOT been given and you select the Benchmark option from Settings, a message will be given directing you to the Consent page. Once Consent is given you will be able to use the Benchmarking option.

Note: Alternatively Consent to join the Bromcom Shared Data Family can be given directly from Config > Analysis > Live Benchmarking.

To give Consent to share your School Data anonymously, set the Switch to Deny or Grant. The Data will then be collected from Consenting Schools and used for Comparison. The default setting for this option is Deny.
Selecting the History button will display who selected the current Status and when.

Viewing the Benchmark Data
From the left Menu select Home > Attendance > Settings

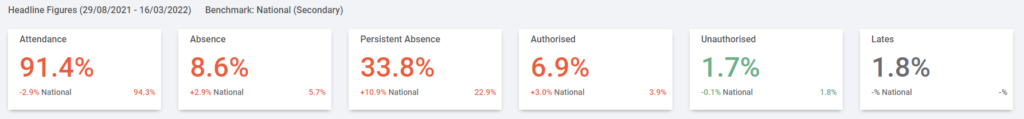
The selections made in the Settings section will be displayed below once Applied. The Headline Figures below will display the National Figure and the Difference between the School Attendance and the National Figure, with appropriate existing colour coding.

The Benchmark dropdown list will be dependent on the Type of School and the Region. A Secondary school will not show Primary options, an All Through School will. Click the i Information button for more details on the selected Benchmark.
When the Benchmark option is selected the Year Group, Tutor Group and Report Group options will be disabled.


The Benchmarking data can also been viewed in the Overall Chart, Absence Chart and Groups Chart. When the Benchmarking option is selected the existing Attendance and Absence Charts will return the selected Benchmarking Data. The Charts behave in the same way as for Attendance, with drilldown options when in Maximum view.
Note: If the Link icon is NOT Broken all the Linked Charts will update with the data selected from the dropdown list. Click on the Link icon to unlink the Charts.
