
In this guide, we are going to explain how Attendance is calculated between Vision, BI and in Bromcom MIS, with the guide being split into three sections.
To ensure attendance figures match across the different platforms this guide looks at ensuring cohort filters such as enrolment status and date ranges are the same.
Pre-requisites: To follow this guide, you must have access to and be familiar with Vision and Power BI.
Access: There are no MIS based permissions required to access Vision or Power BI. You will need a User Account or access to your School’s Vision/Power BI accounts.
Related Guides;
Attendance in Vision
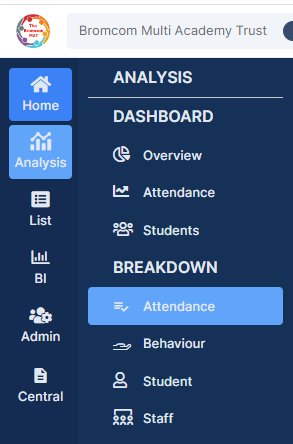
To see an Attendance Dashboard with Chart and drilldown facility within Vision, go to Analysis>Dashboard>Attendance.

On the top right corner of the page, click on Settings.
Under Settings, the Cohort is set to All Students by default. (All Students refers to Current (C) and Main Dual Registered Students (M).
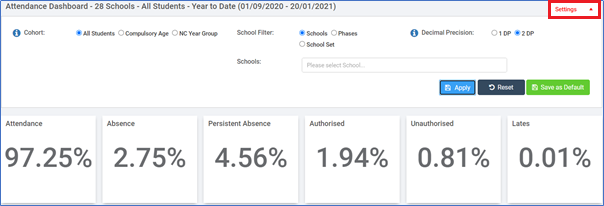
You can also set the Decimal Precision to 2 DP(decimal places) or change the School Filter should you wish.
To see a single Attendance Chart with functionality to drill down to an Individual School and Student in spreadsheet format go to Analysis>Breakdown>Attendance
Click on the top left Filters
From the Filters button under the Data Scope tab, select to show Aggregate and ensure the End Date matches the End date from the Attendance Dashboard.

Under the Cohort dropdown, Current and Main Dual Registered Students are checked by Default.
Please pay particular attention to the Enrolment Status Key
- C = Current Students
- G = Guest Students
- L = Leaver Students
- M = Main Dual Registered Students

Once you are happy with your selections, click the Apply button.

The Aggregate Figure should now match the Attendance Dashboard figure.
Attendance in Power BI
To view Attendance within Power BI, go to BI>Power Bi Viewer.

Now click on the Attendance & Exclusions report.

You then need to ensure that the Enrolment Status‘ selected are the same as the Enrolment Status‘ you have selected in the Vision Dashboard (Attendance Breakdown) prior.

Click on the Groups tab and on the right of All Pupils, it should show the Attendance % as highlighted.
Date Ranges
Please also take note of the Attendance Date Range when comparing Attendance in Power BI with the Vision Dashboard (Attendance Breakdown).
The Date Range in the App is from the week beginning on both Start and End Dates.