
In this guide, we show How to Use the Budget Dashboard
Access: The minimum permissions required to Use the Budget Dashboard are found in the Finance Module section Config > Setup > Roles & Permissions
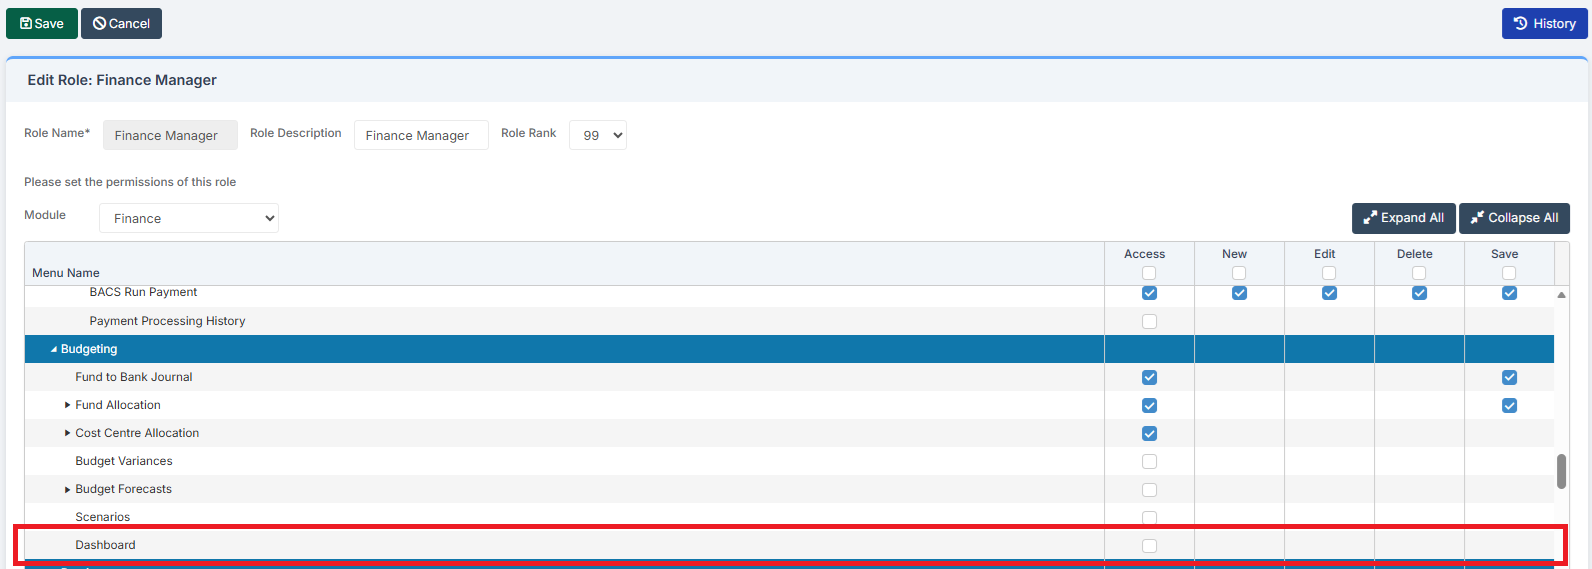
Pre-requisites: In order to view useful information on the Budget Dashboard, a Budget needs to be in place within the Finance Module
Related guides:
This Guide is part of the Budgeting Module User Guide
The previous guide in the Budgeting Module User Guide is: How to Monitor Budgets
The next guide in the Budgeting Module User Guide is: How to Use the Budget Variances Report
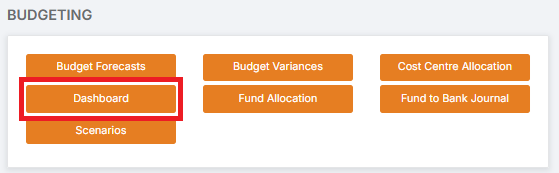
To begin, go to Modules > Finance > Finance Home Page > Budgeting > Dashboard
At the top of the page, click on Parameters to open the Parameters section

Within the Parameters section, select the Financial Year and Budget Scenario to view. Then click Apply

The Dashboard displays five charts
Note: The charts use Dummy Data, so do not reflect what the charts would look like under normal operational use of the Budgeting Module
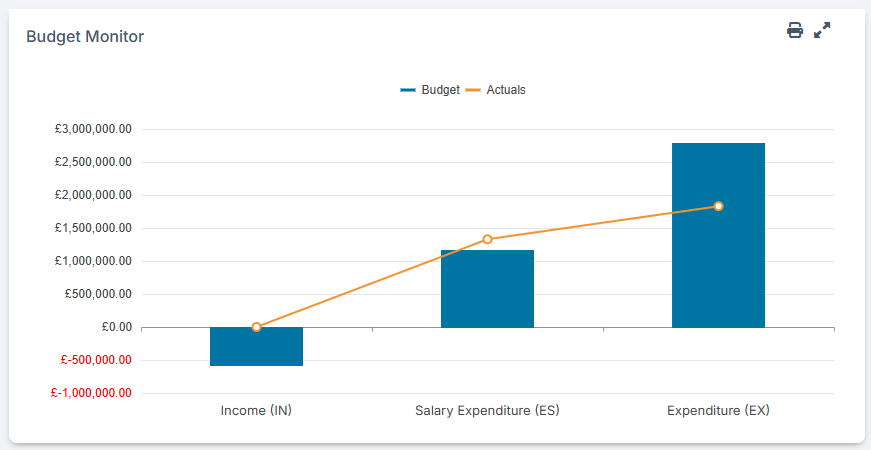
The first chart is the Budget Monitor. This displays the Current Budget and Current Actuals for the criteria set in the Parameters section
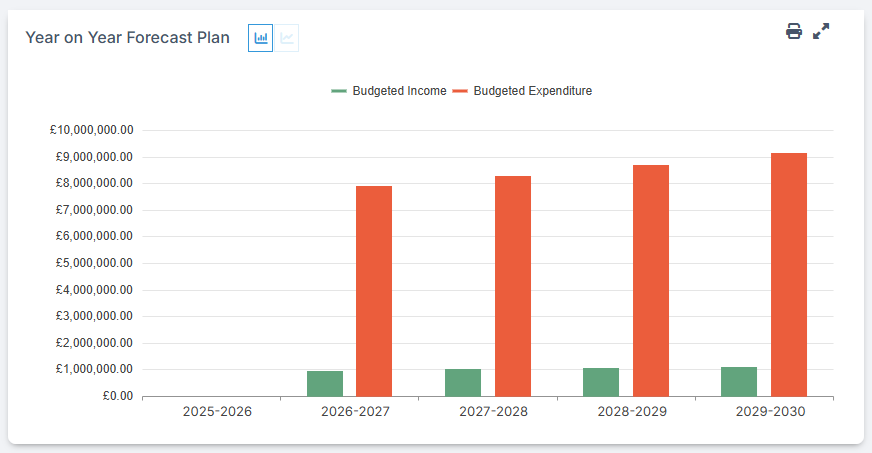
To the right, the second chart is the Year on Year Forecast Plan. This compares Forecast Budgeted Income with Forecast Budgeted Expenditure for the criteria set in the Parameters section
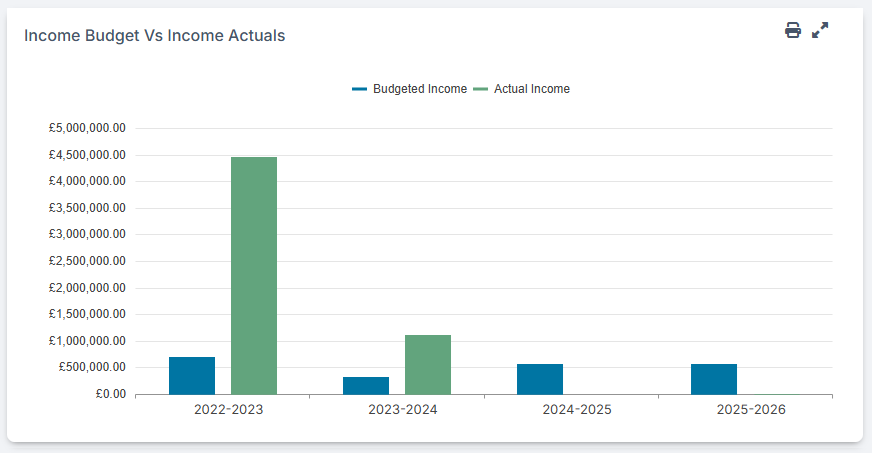
On the next row, the third chart compares Historic Budgeted Income with Historic Actuals Income for the criteria set in the Parameters section
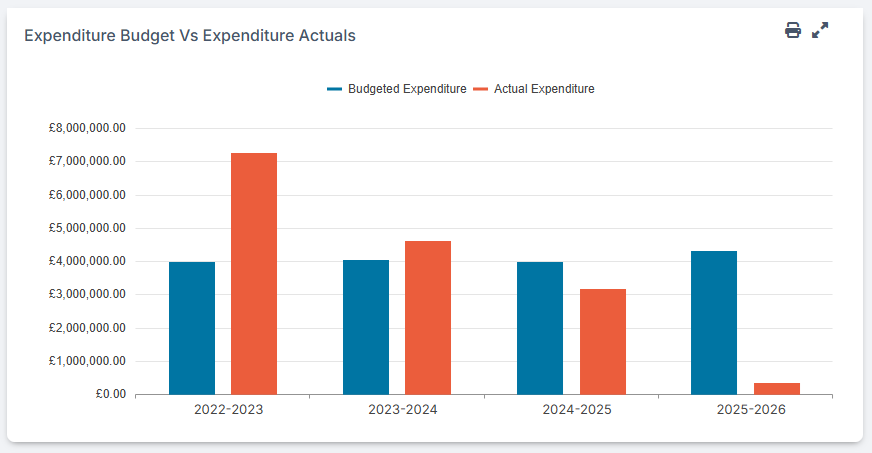
To the right of that, the fourth chart compares Historic Budgeted Expenditure with Historic Actuals Expenditure for the criteria set in the Parameters section
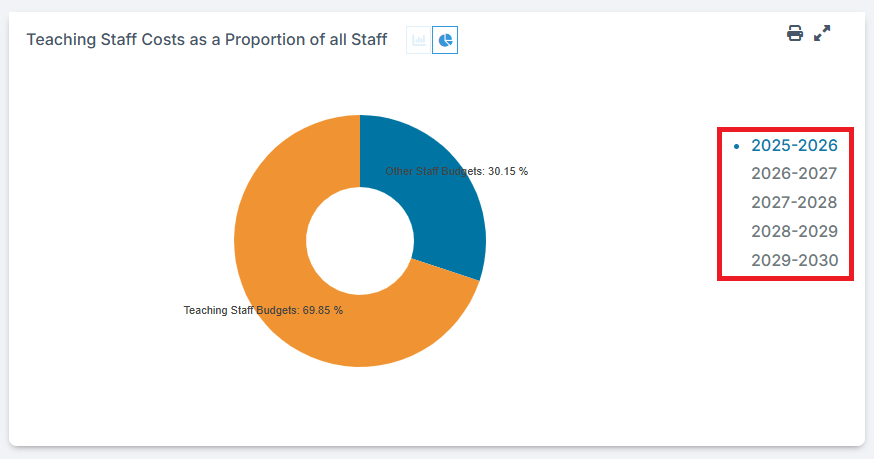
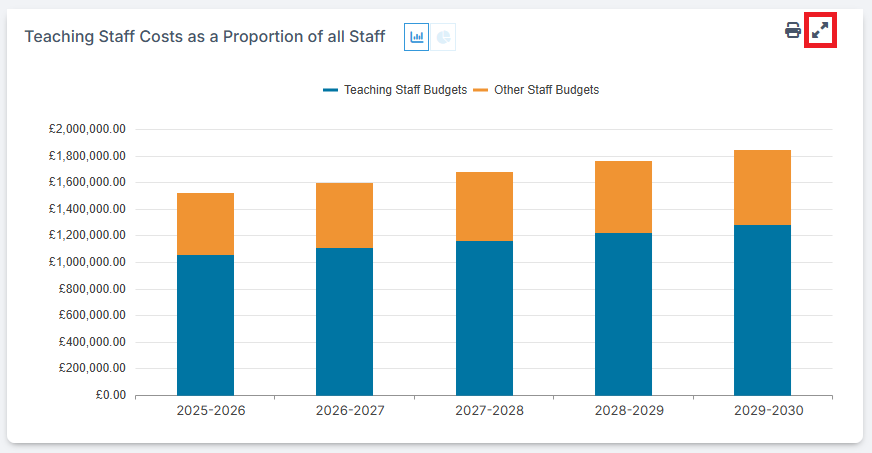
The fifth chart, on the next row, displays Forecast Teaching Staff Costs as a Proportion of all Staff Costs for the criteria set in the Parameters section
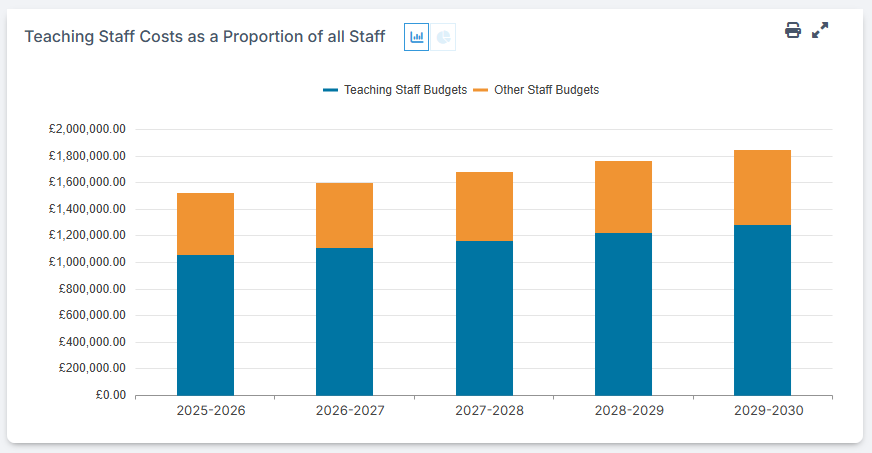
The Year on Year Forecast Plan chart and the Teaching Staff Costs as a Proportion of all Staff chart give the option of toggling between a Bar Chart and a Doughnut Chart
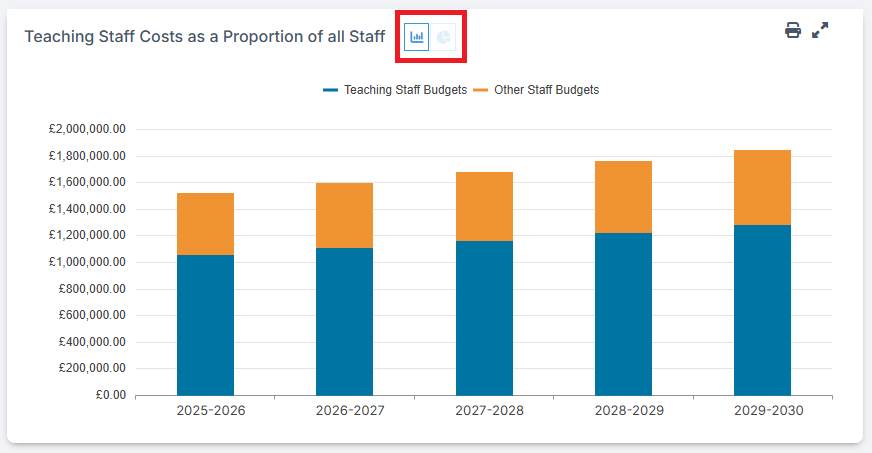
On the right of the Doughnut Chart, different years can be selected
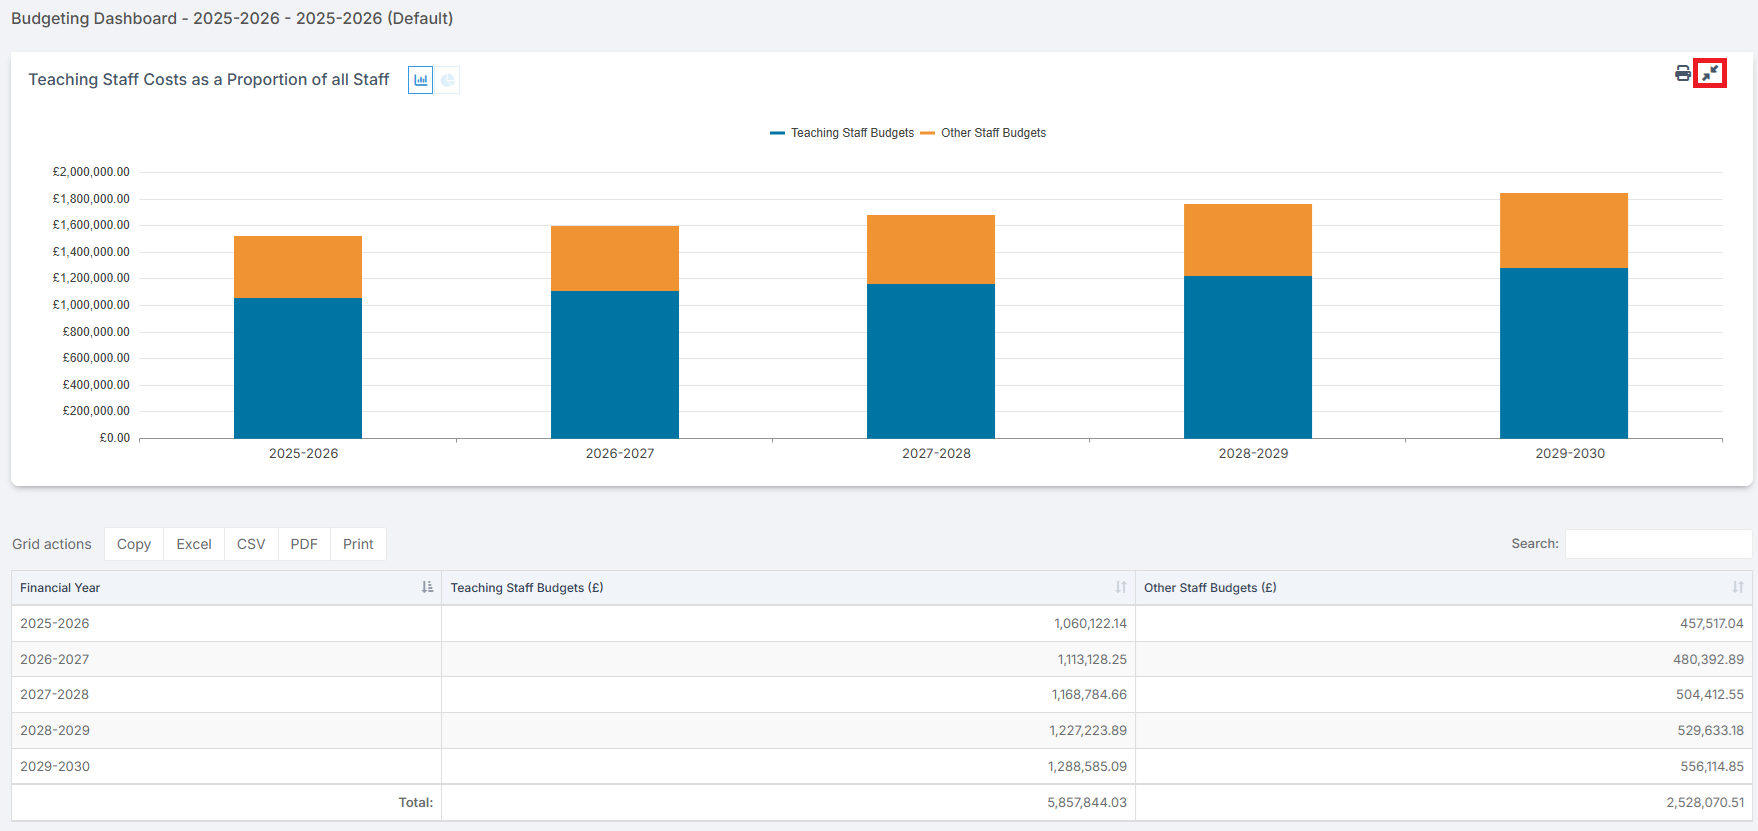
Clicking on the Expand Symbol makes the chart full page and displays the data below it
Clicking on the Reduce Symbol returns the chart to its original size
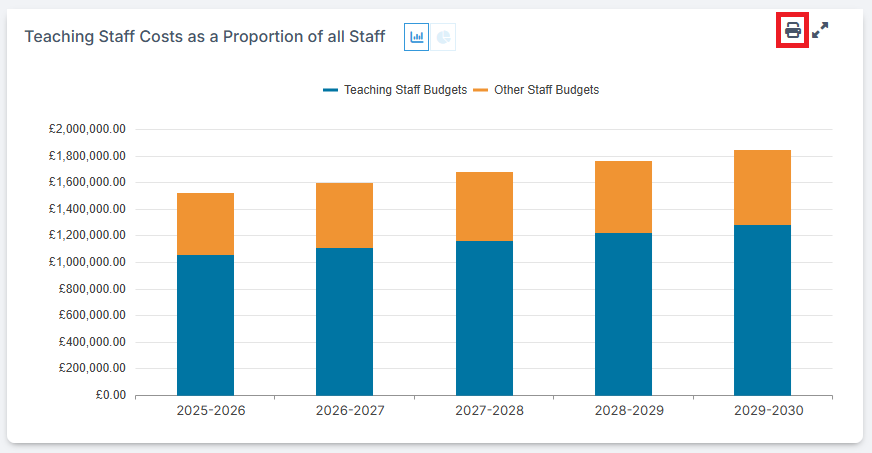
Clicking on the Print Icon exports a PDF of the chart to the Browser’s Downloads Folder
The next guide in the Budgeting Module User Guide is: How to Use the Budget Variances Report