
This guide looks at the following Settings and Filters available within Analysis DASHBOARD and BREAKDOWN tabs within Vision
- Default
- Settings Cohort
- School Filter
- Decimal Precision
- Data scope
- Filters Cohort
IMPORTANT: The example screenshots in this guide are for the Analysis> Dashboard> Attendance and BREAKDOWN> Attendance tabs. The functionality is the same in the other Dashboards and Breakdown tabs.
For further guidance on Vision see here and for School Sets which are covered in this guide see How to Set up School Sets in Vision
Dashboard Settings
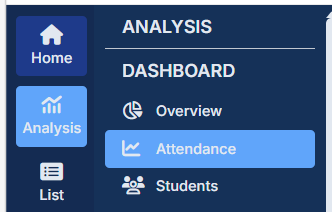
Navigate to Analysis>Dashboard>Attendance
Default
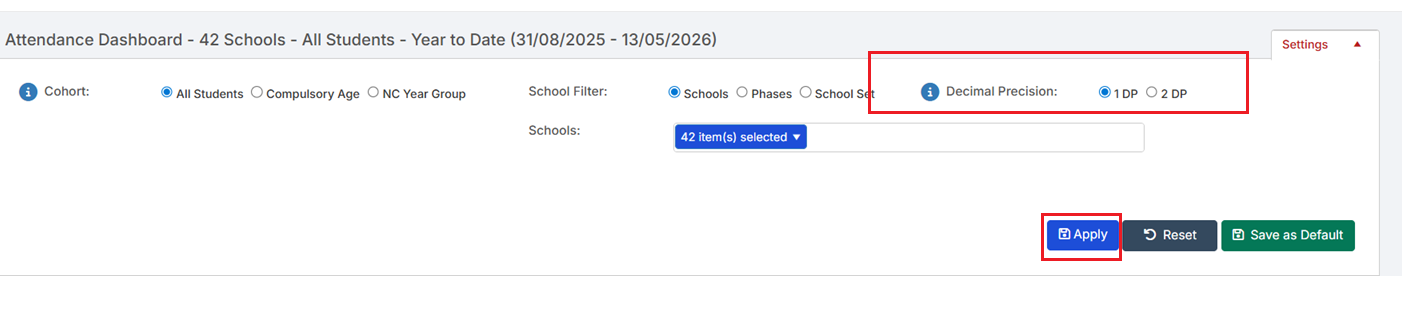
Click on the top-right Settings drop down

The Default Setting is All Students, School Filter = Schools and all Schools selected and Decimal Precision = 1 DP (Decimal Place)
If required any Settings can be set to Save as Default if required.

Settings Cohort
In the top-left there are 3 Cohort options to choose from;
- All Students
- Compulsory Age
- NC Year Group
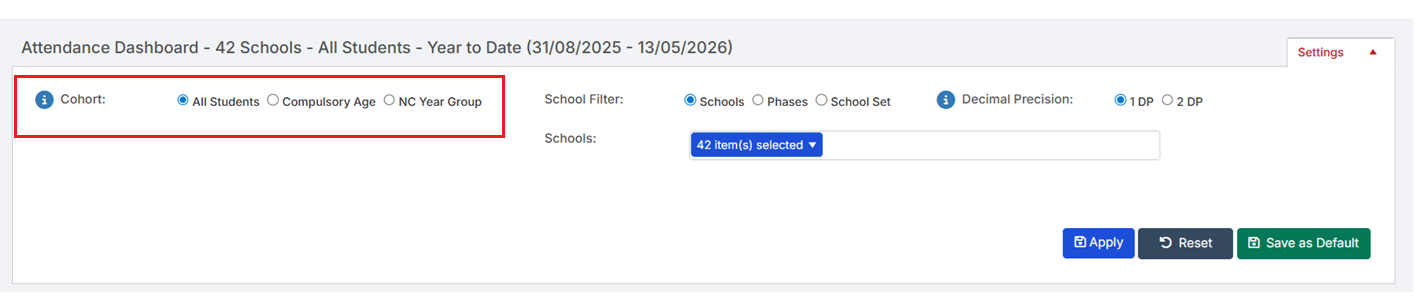
All Students
This includes the following Students;
- Current Students with the Enrolment Status C- Current Single Registration
- Current -Student with the Enrolment Status M- Current Main Registration
- All Year Groups
- DOES NOT INCLUDE LEAVERS
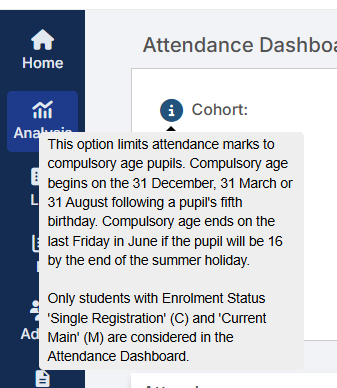
Compulsory Age
Click on the Cohort i to see the following information;
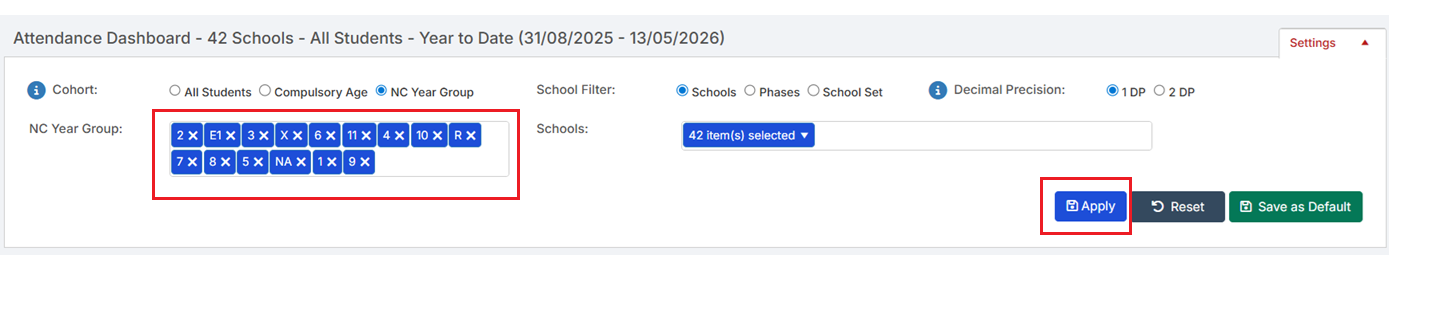
NC Year Groups
When selected simply click to remove any Year Groups if required

In this example we have removed Years 12, 13 and Nursery
Remember to click Apply if any Settings have been amended from the Default
School Filter
Choose from the following;
1.Schools with the option to choose the required Schools
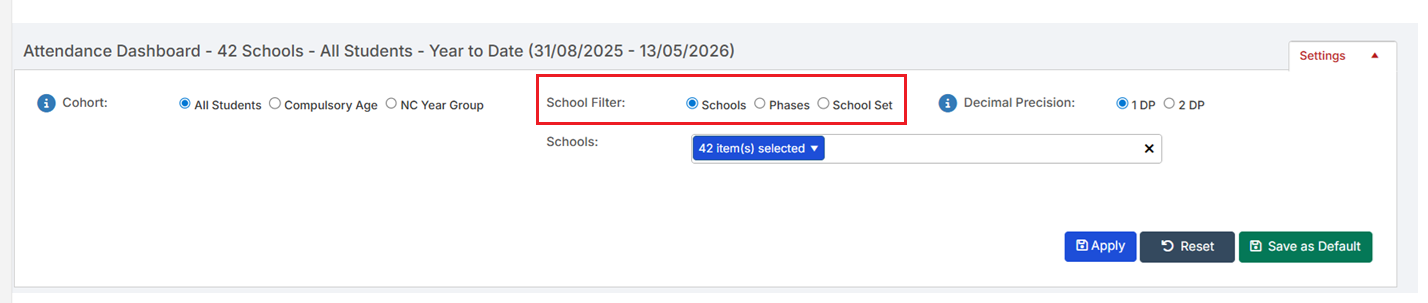
Click on the required blue highlighted School to remove it from the list.
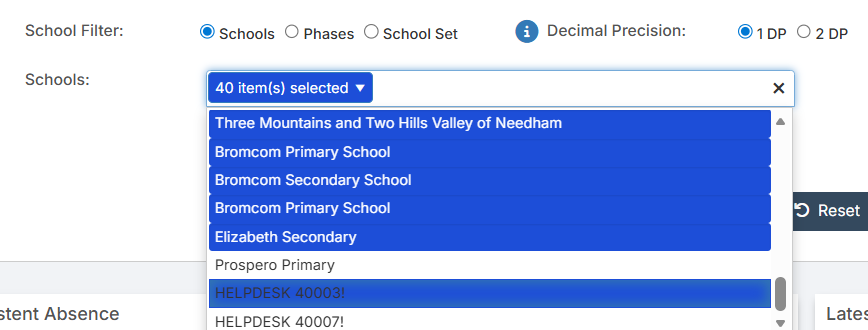
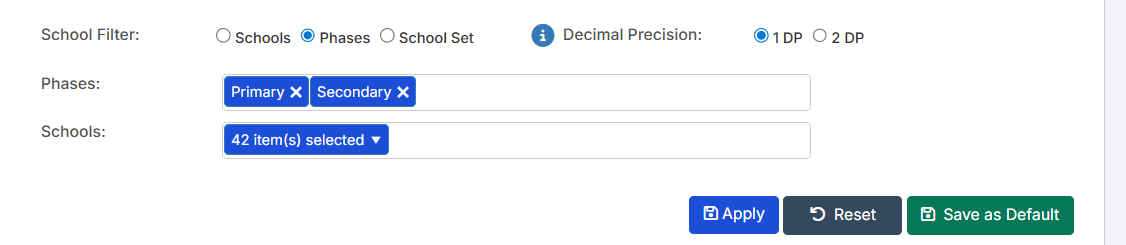
2.Phases with the option to choose Primary, Secondary or both and select specific Schools.
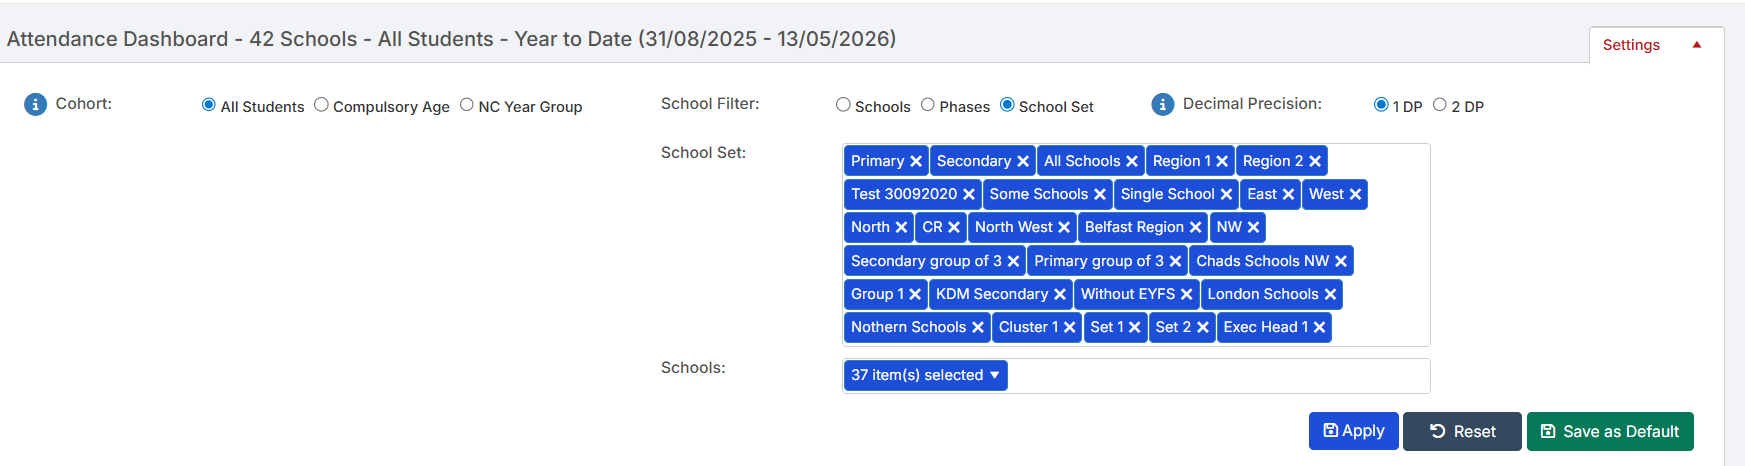
3. School Set; choose from the required School Sets and if required specific Schools, for more information on School Sets see here.
Decimal Precision
Set this to either 1DP or 2DP
Click Apply.
Breakdown
The example screenshots in this section are using Analysis>BREAKDOWN>Attendance, the filters are the same for the other tabs available within BREAKDOWN.
This section looks at the following settings;
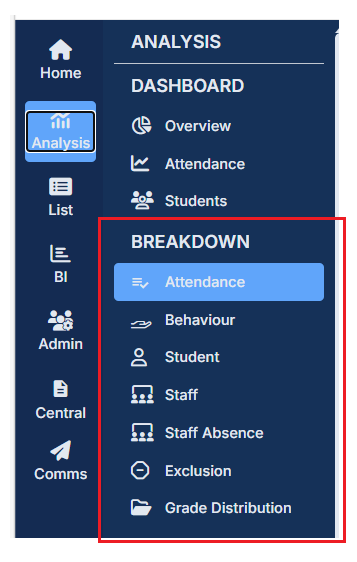
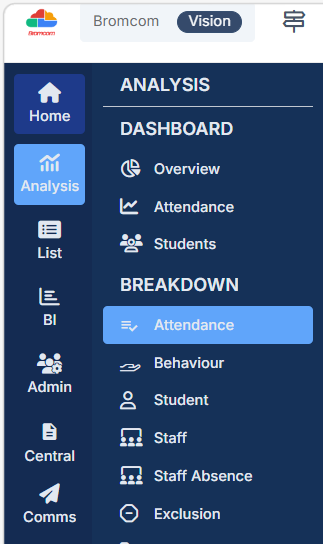
Navigate to Analysis and under BREAKDOWN choose Attendance
Click the top-left Filters

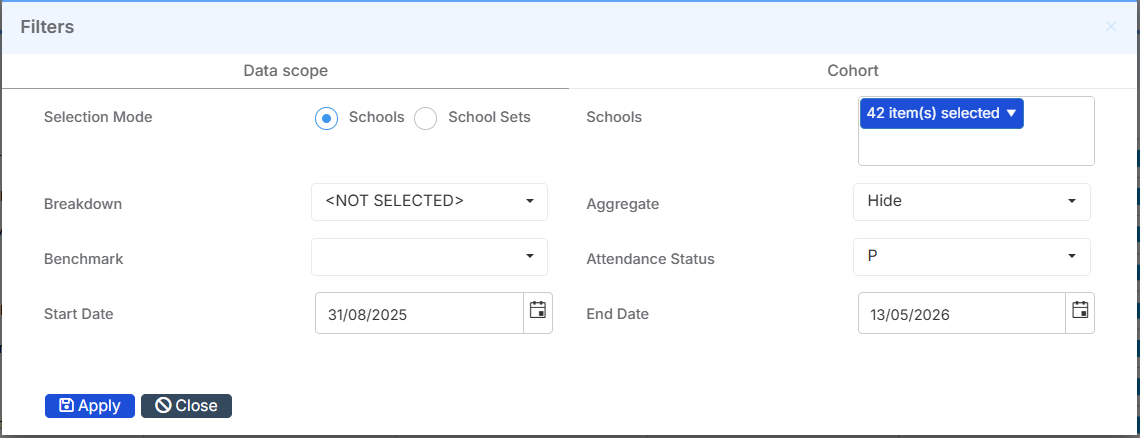
This will open the Filters panel, there are two tabs Data scope and Cohort.
Data scope
- Selection Mode – Choose which Schools to include in the Analysis, click Schools to see a list of all of the individual Schools in the trust to select from, select School Sets to see a list of any School Sets (for more information on School Sets please see How to Set up School Sets in Vision) Note select School Set to see the information per School Set and although individual Student data will be visible to view the data per School is not visible.
- Schools / School Sets – Select which Schools or School Sets to include in the Analysis. All Schools or School Sets are selected by default.
- Breakdown – Allows Attendance data to be broken down further by selected Attributes. For example, selecting Free School Meals in the Breakdown dropdown will display two bars on the chart for each School or School Set: one showing Attendance for those with Free School Meals and one for those without.
- Benchmark – Adds a Benchmark to the bar chart for easy comparison. Select the dataset to use from the dropdown.
- Aggregate – Adds a bar to the chart showing the average figures for all selected Schools or School Sets. Choose:
- Hide – No Aggregate bar is displayed.
- Show – Displays a separate Aggregate bar on the chart.
- Aggregate Only – Displays only the Aggregate value instead of individual School or School Set data.
- Attendance Status – Choose which Attendance Status to report on. Available options are:
- P – Present
- U – Unauthorised Absences
- A – Authorised Absences
- Start Date & End Date – Choose the period of time to view Attendance data for.
If making any changes on this page, click Apply to update the data.
Filters Cohort
Within the Filters pop-up, move to the Cohort tab across the top.

This tab allows further refinement of which Students are included in the Analysis.
- For any of the listed attributes, a specific value can be selected so that only Students who meet that criteria are included in the Analysis.
- For example, selecting Yes in the EAL field will include only Students recorded as having English as an Additional Language in the figures.
Note: Enrolment will automatically filter to C and M.
- When comparing this information with data from other sources, review the filter settings to ensure all applicable Enrolment Statuses are included.
- For example, if other data sources include leavers in the figures, the Enrolment filter may need to be updated to include the L code.
If any changes are made on this page, click Apply to update the dataset.
For further guidance on Attendance Analysis within Vision see here.